Binary options indicators
Indicators and their types
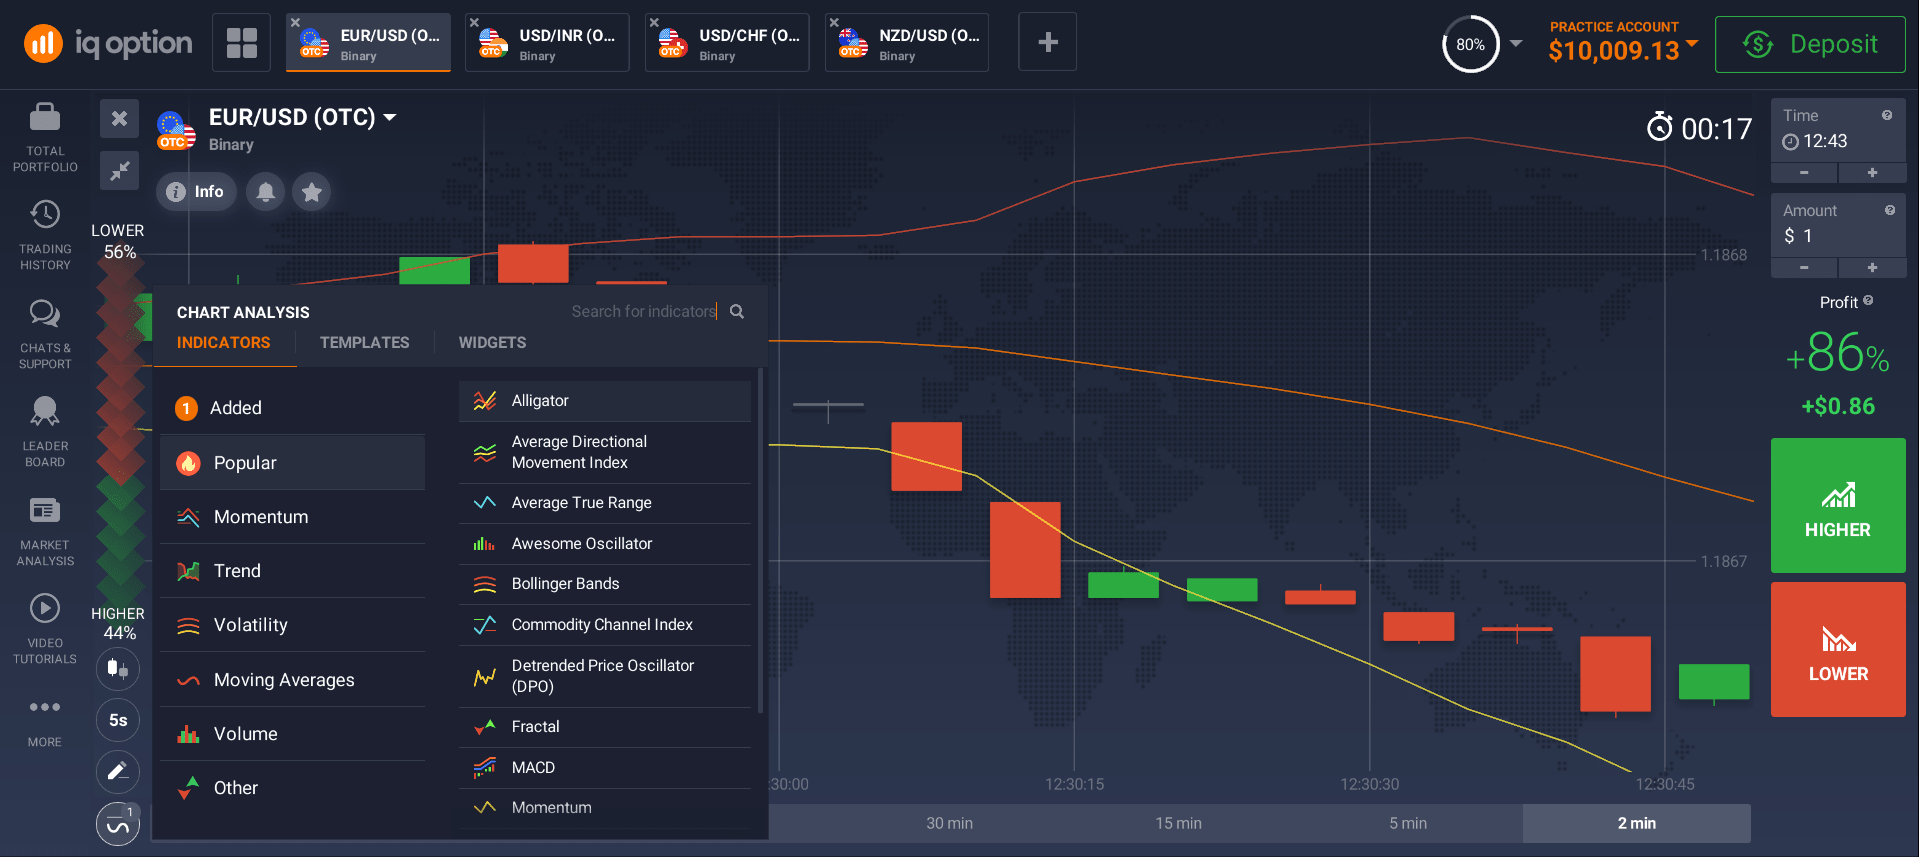
In his work, a trader uses various analysis tools to improve the efficiency of transactions in the stock market and increase the likelihood of success of his investments. Technical indicators are just one of such important tools. Earlier, calculation and drawing of indicators on a chart was made by a trader manually, but with the advent of computers and specialized software, everything has become much easier. The main function of calculation is performed by programs installed in trading platforms, and indicators have moved from the category of mathematical analysis to the category of computer analysis.
Trading indicators can be conditionally divided into three main types:
- Trend-following indicators.
- Oscillators.
- Bill Williams' indicators.

Trend indicators can be used to find trends in the market, i.e. they show traders in which direction the price will change. Trend indicators give an opportunity to determine the price direction with almost maximum accuracy.
Examples of trend indicators:
- Linear regression indicator, LRI
- Price channel, PC
- Standard deviation, SD
- Moving Average MA
- Alligator
- Bollinger Bands
- Rolling Stock Index, ASI
- Envelopes
- Fractals
- Andrews Fork Indicators
- Donchian channel
- Average Directional Index, ADX
- Parabolic SAR
- Zig-Zag
- Ichimoku Kinko Hyo
Oscillators show the price deviation from its average value. In other words, these types of indicators allow you to predict the moment when the price will start to correct, or it will start to fluctuate.
Examples of Oscillators:
- Gator Oscillator
- Moving Average Oscillator, OsMA
- Stochastic Oscillator
- Relative Strength Index, RVI
- Relative Strength Index, RSI
- Price Change Rate, ROC
- Mass Index, MI
- Commodity Channel Index, CCI
- Directional Movement Index, DMI
- Acceleration/Deceleration, AD
- Accumulation/Distribution, A/D
- MACD
- Momentum
- Balance Volume, OBV
- Power Index, FRC
- Senior beams
- Marginal oscillator
- Detrended Price Oscillator, DPO
- DeMarker, DeM
- Awesome Oscillator
- Chaikin Volatility, CHV
- Chaikin Oscillator, CHO
- Average True Range, ATR
- TRIX
- Average Price Weighted by Volume, VWAP
- Bears Power
- Bulls Power
Bill Williams' indicators are universal algorithms, which occupy a special stage in the technical analysis. These tools were created specifically to support the author's strategy. The strategy of Bill Williams is that the author considers absolutely any currency movement to be unpredictable and completely random.
Bill Williams' Indicators:
- Acceleration/Deceleration, AD
- Alligator
- Awesome Oscillator
- Fractals
- Gator Oscillator
- Market Facilitation Index, BW MFI
Application of Indicators for Binary Options
Trend indicators and their application.
Trade with the use of trend indicators for binary options allows you to determine where the trend will move in the future, whether it will be closed or a new one will appear, and all this with a minimum time delay. It should be noted at once that it is ineffective to use these indicators at the moments of flat (no trend).
Envelopes.
The Envelopes indicator belongs to the class of simple algorithms, designed for analyzing the binary options market. Sometimes this indicator is called "envelopes lines". The point is that Envelopes represents two parallel lines, equidistant from the central moving average. Basically, this is the whole description of the Envelopes indicator, there is nothing to stress here, because it is impossible to think of something simpler.
Donchian Channel.
Donchian Channel indicator is a volatility indicator, which generates a price range at a specific point in time on the chart, based on the maximum and minimum prices of the asset of the previous period. Donchian Channel indicator is displayed in the form of top and bottom lines, which are drawn on the basis of calculation of maximum and minimum price values during the previous trading period.
ZigZag.
The ZigZag indicator belongs to trend-following indicators and is shown in the form of line segments, connecting local price extremums. This makes it possible to consider important market movements without taking noises into account. Unlike many other technical tools, ZigZag does not forecast price behavior in the future, but only indicates significant changes in the past. Also, this indicator is often used in conjunction with Elliott Theory to identify major waves and corrective pullbacks. The main idea of ZigZag indicator is to cut the market noise. ZigZag helps to objectively assess market behavior and not to miss a strong movement.

Oscillators and their application.
Exactly when trend indicators are not very effective, oscillators come to help. Traders try to use oscillators in the moments when trend indicators are not very good or their use is ineffective. In other words, oscillators are used when the price change is observed in a certain corridor of currency rates. The use of oscillators makes it possible to gather complete information about the trend situation, as well as to estimate and predict the rates and positions.
A distinctive feature of oscillators is that notifications (signals) of all changes come practically synchronously with these changes and sometimes even ahead of them. All kinds of oscillators work within certain (individual) frames and give signals immediately in case of a rate change.
Elder-Rays, Bears Power, Bulls Power.
Elder-Rays technical indicator is a combination of the features of trend-following indicators and oscillators. They use exponential moving average (EMA) as a tracking indicator. Oscillators reflect the power of bulls and bears. To build Elder-Rays, three charts are used: one plotting the price chart and the EMA, the other two plotting the Bulls Power Oscillator and the Bears Power Oscillator.
Elder-Rays are used both independently and together with other methods. If you use them independently, you should take into account that the EMA slope determines the trend direction, and open positions in its direction. The Bulls Power Oscillator and Bears Power Oscillator are used to determine the moment to open/close positions.
Chaikin Oscillator, CHO.
Chaikin Oscillator, CHO is a hybrid unique custom indicator. This indicator was created by Mark Chaikin. The basis of the Chaikin Oscillator indicator are moving averages, which calculates the Accumulation/Distribution of indicator data.
Chaikin Oscillator is an ordinary MACD indicator, only applied to Accumulation and Distribution tool. Chaikin Oscillator calculates the difference between the 3-day simple moving average and the 2-day simple moving average Accumulation/Distribution indicator.
The Chaikin Oscillator indicator is designed to predict indicator changes in Accumulation/Distribution. If the usual MACD indicator by moving averages allows the trader to determine the value acceleration parameters, the Chaikin Oscillator analyzes not the value, but the Accumulation/Distribution lagging instrument acceleration type. The Chaikin Oscillator indicator developed by Mark Chaikin is able to outperform Accumulation/Distribution indicator data.

Bill Williams' indicators and their application.
Bill Williams is a famous trader-analyst, who adheres to Chaos theory. He created his own group of indicators to support his trading strategy. According to Bill Williams, excessive engagement in analysis is a waste of time and a completely useless activity. To raise the level and decrease the percentage of losses, traders simply need to understand the market structure. That's why, in his opinion, trading systems should not contain any elements dealing with forecasts, and traders' profit will be determined only by how good and clear their strategy will be.
Gator Oscillator.
Gator Oscillator was developed by Bill Williams for his trading strategy based on the principles of Chaos Theory, is a visually more obvious variant of the Alligator indicator and is usually used together with it. The indicator is included in the basic set of tools for technical analysis in the trading terminal MetaTrader. In Williams' opinion, it is a good indicator showing a "sleeping" period, which means the end of a trend, a lateral (flat) market movement and the moment when the Alligator "wakes up", i.e. when a new trend appears in the market.
Graphically, Gator Oscillator is represented as two interconnected bar charts, the bars of which are colored green if the previous bar is bigger than the current one and red if it is smaller.
Fractals.
Fractals is an indicator and an element of Bill Williams' trading strategy. It is used to find trend reversal points, local price extremums and strong price levels. The fractal indicator is included in the basic set of technical analysis tools in all popular trading terminals and is displayed on the price chart as up and down arrows on the key bar.
Visually, a single fractal is a graphical figure consisting of five consecutive price bars or candlesticks, and indicates the level at which price failed to set a new maximum or minimum. A group of five candles in which the maximum of the third candle is greater than the maximums of the two right and left candles is called an upper fractal. The reverse combination, where the minimum of the third candle is lower than the others is a lower fractal.
Best Indicators for Binary Options in Hong Kong
The best indicators for binary options in Hong Kong are those that will help you trade easily and profit from binary options trading without much risk. But what indicators should you look for? First of all, you need to find a good trading platform, preferably with a demo account, so you can practice with virtual money and not risk real money.
Inexperienced traders often make the mistake of risking too much money in one trade, and end up losing it all. They do not have enough experience to choose the best indicators for binary options.
The best indicators for binary options in Hong Kong will be those that provide useful information about trading trends. This is especially useful when you trade using multiple tickers. The trading platform should provide information on volume, open interest and other relevant data. This will allow you to make informed trading decisions and limit your risks when using the best indicators for binary options. In fact, the trading platform should be designed so that it also provides you with charts and other technical analysis tools to help you make good decisions and make profitable trades.

When choosing the best indicators for binary options in Hong Kong, the first thing to consider is the source. You should always choose a good trading platform that has a proven track record and has a good reputation for providing reliable indicators and trading tools. There are many websites and blogs that offer free information about trading and other related topics. If you don't know where to get information, you will have no trouble finding the best indicators for binary options. In addition, in fact, most trading platforms offer free training and advice on many aspects of binary options trading.
However, you need to make sure and be sure that these indicators are practical and useful in actual binary options trading in Hong Kong. There are many indicators available online, including very useful and accurate ones, but none of them will be useful if they cannot be incorporated into your trading strategy.
Using the best indicators for binary options increases your chance of trading success and will allow you to identify trends and patterns to increase the overall profitability of your investment portfolio.
There are many great indicators for binary options in Hong Kong that you can use on your trading platform. However, you should consider the many factors that the indicators point to. For example, if you want to take long binary options positions, you need to be aware of the bull market trend. This ensures that you will be able to determine when it is best to open a long position. In addition, the indicator should also give you a good idea of when you should exit a position.
The best indicators for binary options are the ones that are easy for you to understand.
If you want to reduce the risk associated with binary options trading, it is advisable to use the best binary options indicators. You will find that there are some very good indicators that provide you with very reliable signals.

Once you have practiced trading binary options with a demo account, you can open a trading account and start trading with real money. Sometimes you need to make a small deposit on the platform to open a trading account. You can then fund your account on the platform with the amount you need to trade binary options in Hong Kong. Investing in binary options is very profitable for the trader and you will definitely win!
Related pages
No deposit bonus for binary options

